01

Project Origins

The inspiration for this project—making a map of the Civil War’s guerrilla violence, as opposed to its battlefield violence—came about at West Virginia University (WVU) and the National Park Service from 2011-2013. I worked as a Park Ranger in the summer between my two years at WVU. At the parks, we started off every battlefield tour in front of a map, because it’s the only way you can make sense of such violence. (Imagine a five-year-old dressed up in a Confederate uniform in a crowd of fifty people raising their hand and asking why soldiers who didn’t know one another tried to fill each other up with bullets. Yes, that happened to me while giving a tour of the Battle of Fredericksburg.) The best way to answer that question was to explain that almost 200,000 strangers tried to kill each other because of the railroad on the map: it led straight to Richmond, Virginia—the Confederate capital. If the Union army could take that railroad, they could possibly end the war. As it turned out, they couldn’t; instead, tens of thousands of Federal troops assaulted an entrenched Confederate line, resulting in one of the war’s most lop-sided battles.  
Me in uniform. Such a cool job. I worked under Greg Mertz.
....historians couldn’t make a map of guerrilla war until the advent of digital mapping techniques—the guerrilla war’s size and scope was too big for traditional mapmakers.
After work, I read up on the guerrilla war literature that would form the bibliography of my master’s thesis at WVU. This was a very different war from the one I interpreted for park visitors every day, one devoid of honor, civility, and order, but replete with savagery, nihilism, and terror. However, a glaring hole existed in this literature: there were no maps. The most powerful tool at my disposal to make sense of violence on America’s battlefields was completely missing from historians’ analyses of guerrilla warfare in the Civil War. To be sure, historians couldn’t make a map of guerrilla war until the advent of digital mapping techniques—the guerrilla war’s size and scope was too big for traditional mapmakers. Guerrillas operated on any given day, in any given space, throughout the Confederacy. That covers 1,500 days and 770,400 square miles (and doesn’t even include the guerrilla-style violence in the Missouri-Kansas border war throughout the late 1850s or the guerrilla-style violence enacted by paramilitary groups like the Ku Klux Klan throughout Reconstruction).
Aaron Sheehan-Dean on the right
Back at WVU, my training in historical research methods under Aaron Sheehan-Dean taught me that the scale from which we view war determines what we see. On the ground, we see savagery—thousands of troops running into a slaughter at Fredericksburg.From a bird’s-eye-view, we see order and logic—Robert E. Lee’s legendary strategy and tactics at the same battle. Because historians never looked at guerrilla war with a bird’s-eye-view, all they saw was savagery. Pretty simple, really.
I set out to view guerrilla war from a bird’s-eye-view by using geographers’ preferred spatial analysis system: ArcGIS. This software enabled me to map multiple layers of data over vast swaths of space and time and run hundreds of tools that illuminated patterns within that data. The essence of guerrilla warfare, and therefore the content of these maps, consists of three main groups: instances of guerrilla violence, the Union army’s location, and southern-sympathizing and guerrilla-aiding households (referred to collectively as guerrillas' domestic supply line). By discovering when and where instances of guerrilla violence occurred in relation to the southern-sympathizing civilians and Union soldiers present in the landscape, we can actually see the mutual locations where guerrilla warfare’s participants operated. It was in this symbiotic space that guerrillas and Union troops continuously reinvented their war-making policies, practices, and the justifications for both.

02

Historical Conclusions

My interpretation of these spatial relationships led to four key conclusions. First, temporary Union occupation incited guerrilla violence. Guerrillas frequently operated in locations previously occupied by small outfits of Union troops (typically cavalry units). Furthermore, guerrillas targeted weak spots in Union war industries—small garrisons, railroads, telegraph lines, and supply trains—and gray areas within official Union combatants—militias, Home Guards, and furloughed soldiers.
Not only did guerrilla violence influence the conventional war’s conduct... it created a unique household war zone that swallowed any person—commander, soldier, vigilante, guerrilla, or citizen—living in occupied territory.
Second, guerrilla violence relied on a web of rebel households. Guerrillas' “domestic supply line” enabled them to operate by functioning as quartermaster, supply line, and command and control center. In essence, these first two arguments inject order and logic into guerrillas’ violence. They also tack closer to interpretations of guerrilla war espoused by historians outside the American Civil War field.

Third, because Union occupiers rarely killed guerrillas and increasingly turned to attacking guerrillas' domestic supply line instead, the home front and conventional battlefield were not separate entities but a single, irregular war zone. Despite official policy (historians typically cite the restraints present in Francis Lieber’s General Order No. 100—the instructions for Union field armies), the Union army synthesized its regular and irregular strategies in response to guerrilla warfare. Not only did guerrilla violence influence the conventional war’s conduct, as Daniel Sutherland argues, it created a unique household war zone that swallowed any person—commander, soldier, vigilante, guerrilla, or citizen—living in occupied territory.

Last, despite all of these patterns, guerrillas still utilized terrorism. They often targeted victims at random and employed tactics—ambushes, posthumous mutilation, retreats—deemed inhumane and cowardly by typical nineteenth-century standards. American Civil War historians’ previous conclusions about guerrillas are not wrong, they’re just unbalanced. This project is entitled Of Methods and Madness as a nod to the scholarly giants whose shoulders my work stands upon.

For detailed descriptions of evidence leading to these conclusions from Missouri and Kentucky, please see previous versions of the project located in Project History.

As the project’s current form uses data from the entire war (and not just Missouri and Kentucky—the states explored in my dissertation), I’ll risk extrapolating my conclusions to our conceptions of war, in general. To do so, I can’t help but borrow from two military theorists whose opposing viewpoints dominated global conceptions of war in the nineteenth century: Carl von Clausewitz and Antoine-Henri Jomini. Jomini condemned guerrilla war as uncivilized and “so terrible that, for the sake of humanity, we ought to hope never to see it.” On the other hand, Clausewitz accepted guerrilla war as part of the human condition. He believed that Jomini’s idea of “civilized” warfare was only “war on paper”—a veil to cover up the fact that war can never be civilized; it is not a rational act between governments and it cannot be conducted free from emotion, passion, and hostility. “Real war” was different, it was “an act of force to compel our adversary to do our will.” Clausewitz acknowledged that ruthless brutality was the quickest way to achieve this end. Guerrilla war, then, was an unfortunate “intensification” of violence, but an inevitable part of war, nonetheless1.  

Of Methods and Madness maps guerrilla war in the hopes that if scholars ask precisely where and when guerrilla violence occurred, they can get closer to the answer of why it occurred, getting closer to understanding its essential nature. The project's findings—patterns between guerrillas and Union soldiers and a reinforcement of the necessary role of domestic spaces—serve to demythologize the interpretation of the Civil War as a limited, conventional one between formal armies and instead tack closer to Clausewitz's conception of "real war." This scholarship forces us to answer to the chaos and brutality which characterized America’s Civil War in light of today’s wars. If we can better understand how the Civil War's guerrilla conflict became such hell, perhaps we can better understand war in all its hellish forms, whether it took place in the bush of Missouri, the trenches at Spotsylvania Courthouse, the beaches at Normandy, the jungles of Vietnam, or the mountains of Afghanistan.

03

Data

The following section examining OMAM’s data discloses four characteristics of each consulted source, including
What each source depicts on the map;
A description of how the source material was originally collected;
A description of how archivists and digital humanists preserved these sources; and 
Each source’s limitations.
The Official Records of the War of Rebellion

The Official Records of the War of the Rebellion2

This particular version of OMAM draws its data from the War Department’s Official Records of the War of the Rebellion (OR), which comprises what historian Yael Sternhell called “the basis for what we know about the Civil War.” This source is so robust—128 volumes of primary evidence at roughly 900 pages per volume—that it generates data for every layer on the map: guerrilla violence, Union army movement, and guerrillas’ domestic supply line. 

In 2016, Sternhell published a brilliant article in the Journal of American History that detailed the OR’s collection and preservation processes, along with its inadequacies. A summary of that work will suffice here. Most importantly, Sternhell discovered that the OR’s creation took place in the context of sectional reconciliation. In fact, the “Confederacy’s leadership was instrumental in correcting, fact checking, and proofreading the documents that would make up the OR.” Not surprisingly, “ex-Confederates were first and foremost concerned with propagating their version of the facts” (as were the northerners involved in the project). As a result, the evidence included in the OR “offered historians the documentary basis for narratives that gave both sides an equal voice and made battlefield drama the central interest of Civil War history. It enabled the comforting, reunionist histories that marginalized the importance of emancipation and generally ignored the role of African Americans.”3

Therefore, at its heart, this project’s current version leaves a gaping hole in the historiography: the role of race in the Civil War’s guerrilla conflict. It is my hope that in laying this deficiency bare, other scholars will bear its torch as soon as possible. 
Dyer working on the Compendium

The University of Richmond’s (Digital Scholarship Lab) “Visualizing Emancipation” Union Army Dataset

This data illustrates the Union army’s spatial location throughout the war (representing the points army regiments visited, but not the spaces over which they travelled). The source’s transformation, from actual boots on the ground to a written reference work to points on a map, spans over 150 years.
 
One set of those boots belonged to Frederick H. Dyer, who ran away from school to join the army at age fourteen. He served as a drummer boy in the 7th Connecticut, “and there is nothing in Dyer’s record to suggest that he was anything but a solid character and a dutiful soldier.” Dyer survived the war and worked as a “commercial traveler” when not engaged in his duties as Commander of the Pennsylvania Department of the Grand Army of the Republic. Dyer took seriously the latter position, compiling regimental histories at each meeting—from veterans and historical archives—and obsessing over their completeness and correctness. One journalist claimed that it “used to be a favorite trick of his to stand up in an audience of 500 to 1,000 old soldiers and challenge any man to name a regiment whose record of service he could not give.” He kept at it for almost forty years until enough veterans—General Sherman included—convinced him that the war’s importance necessitated a compendium of regimental histories, violent engagements, casualties, and officer commands, and that Dyer was the only man for the job. It seems those veterans were right, for Dyer’s work ethic in completing such a compilation is almost beyond words: "He stuck to his work with a dogged determination that meant a sort of heroism that not many understand. For five years he kept at his desk leaving it only to eat a little and to sleep a little. He was at it before breakfast, he kept at it until after midnight. He isolated himself in his room for weeks at a stretch. … Seven times he went over his list of battles to make sure that nothing had been omitted and that no mistakes had been made in dates, that the list of killed had been properly reported and each time this revision took him seven months." 

The result defies comparison. Dyer’s Compendium of the War of the Rebellion consists of “thousands of sheets, millions of words, involving the examination of 10,000,000 names and dates, every line of it prepared by [him] … without the aid of a secretary or even a stenographer.” Of Methods and Madness consults two of its three volumes, Volume I: Battles and Volume III: Regimental Histories. Despite the impossibility of perfecting such a reference work, immediate veteran reviews praised its accuracy and today’s archivists and historians agree on its “general reliability.” In fact, over a century after its publication, Dyer’s Compendium remains the most comprehensive collection of Union regimental histories to include spatiotemporal information.4

In the 1980s, Gregory Crane and the Tufts University Perseus Digital Library digitized all three volumes of Dyer’s Compendium. This process identified which words in Dyer’s text contained spatial information and made the digital text publicly available online.5
A screenshot from Perseus’s version of Dyer’s Compendium.
In 2012, the University of Richmond’s Digital Scholarship Lab launched “Visualizing Emancipation,” a “map of slavery’s end during the American Civil War.” “Visualizing Emancipation” plotted the Union army’s location on a map of the United States using Volume III: Regimental Histories of Dyer’s Compendium. Furthermore, the site made that data available for download.6
A screenshot from “Visualizing Emancipation.
Each stage of this source’s data transformation contains unique limitations. First, Dyer’s Compendium contains known and unknown errors. Dyer worked at the regimental level and did not include many company-level movements in his work. This poses a problem as the Union military sent many companies on search-and-destroy missions specifically targeting guerrillas. Similarly, many Union “detectives”—who were given small squads of troops and extreme leeway in breaking official policy toward civilians—investigated guerrillas and their supporters; Dyer did not document such activities. Dyer drew much of his evidence from the OR, meaning any errors, omissions, or biases in that source transmitted to his Compendium. Additionally, a large amount of guerrilla violence enacted against civilians actually targeted members of local Unionist militias. Dyer did not account for many civilian militias. This omission enhances the image of guerrilla violence as anarchic by enabling historians to characterize guerrillas’ targets as innocent civilians instead of proactive extensions of the Union army (Unionist militias often received arms from the army and contained former soldiers and/or soldiers’ family members). 

Concerning terminology, Dyer used 117 terms to describe the Union army’s movements (for example, ‘about,’ ‘outpost duty,’ ‘transferred,’ or ‘marched’) and often used multiple terms to describe the same line of data (for example, ‘repulsing’ an attack before ‘marching’ somewhere nearby and performing ‘guard duty’). Furthermore, Dyer never defined his terminology (for example, explaining the differences between a scout, expedition, or reconnaissance mission). Lastly, Dyer was a Union veteran and Union subjectivity must be taken into account.7

Second, the Perseus Digital Library introduced errors during digitization. Digitizing a textual document involves scanning the document into a computer and using Optical Character Recognition (OCR) software to convert the scanned image of text into text itself. This software is imperfect; misspellings and omissions inevitably occur. The Perseus Digital Library’s Managing Editor, Lisa M. Cerrato, stated that the “OCR clean up error quality was contracted at 98.5%,” although the Library has not checked the actual output to ensure that 98.5% of Dyer’s text was correctly digitized. Additionally, Perseus identified which words in the digitized text portrayed spatial information by tagging “placenames” (for example, tagging the placename “Tuscumbia, Alabama” in the sentence “Expedition toward Tuscumbia, Ala., December 9-24”). Perseus did not tag every placename in Dyer’s text. For example, Perseus did not tag regions (such as “North Alabama”) or features of the built environment (such as “Cobb’s Mill” or “Brown’s Ferry”). Again, the Perseus Library has not checked the digitized text to calculate a percent error of its tagging process (or to discover how many locations are missing).8
Perseus’s digitized version of Dyer’s text.
Third, “Visualizing Emancipation” introduced errors during its geotagging process. This process works by using an algorithm to match latitude and longitude coordinates with the placenames Perseus tagged in Dyer’s text. To do this, the algorithm searches an online database of placename coordinates, in this case, the Getty Thesaurus of Geographic Names® Online, which contains 4,100,000 placenames and their associated latitude and longitude. The automated geotagging process could not identify every location in Dyer’s Compendium for multiple reasons. First, the Getty Thesaurus does not catalogue every location in Dyer’s Compendium; this is especially true for historical locations. For example, the 80th Illinois Infantry fought at “Blount’s plantation,” but Getty does not contain coordinates for Blount’s plantation. Second, some placenames have multiple locations, such as “Springfield.” If Dyer did not list a state or county, the algorithm does not know which “Springfield” to choose (or it may choose the wrong one). Lastly, Getty uses the coordinates of water feature’s starting point. If Dyer mentioned the “Mississippi River” when describing General Grant’s approach to Vicksburg, Mississippi, the geotagging process may have mistakenly identified Grant’s approach at the Mississippi River’s starting point in northern Minnesota. “Visualizing Emancipation” notes that their map of Union army “locations should be regarded as approximations subject to a number of caveats” (described above) but does not disclose an error quality percentage. Despite these shortcomings, “Visualizing Emancipation” remains the very best map of the Union army’s wartime movements—no other map comes close in breadth or accuracy. The dataset contains 42,109 locations, only eighty-eight of which do not have latitude and longitude coordinates. I uploaded the dataset into Of Methods and Madness as is, without attempting to correct any inaccurate tagging or geotagging errors. Only a project dedicated to that task could do so properly.9
A search on the Getty Thesaurus of Geographic Names® Online.
A screenshot of the in-progress Vol. I: Battles database.

Incomplete dataset of Dyer’s Compendium, Vol. I: Battles

This dataset, spearheaded by myself and Scott Nesbit, illustrates the Union army’s violent engagements throughout the war, as derived from Volume I: Battles of Dyer’s Compendium. This dataset’s collection and limitations are nearly identical to those described in the above section on Union army data; we used the same algorithm to identify placenames and latitude and longitude coordinates. The dataset contains 12,181 violent engagements, 6,633 of which I have crosschecked latitude and longitude coordinates.
A screenshot of NHGIS.org.

Geopolitical Boundaries, Demographic Data, and Transportation Networks

This data delineates the country’s natural and man-made geographic features and provide statistical information useful for analyzing guerrilla war. Applicable datasets include 1860 county and state borders along with population and demographic statistics, courtesy of the National Historical Geographic Information System (NHGIS). The national 1861 railroad system comes courtesy of the University of Nebraska-Lincoln’s (UNL) “Railroads and the Making of Modern America” project. Nineteenth-century navigable river systems come courtesy of Vanderbilt University’s Jeremy Atack. All other river systems come courtesy of Natural Earth, a “public domain map dataset.” Latitude and Longitude graticules also come from Natural Earth. Latitude and Longitude coordinates for cities come from the Getty Thesaurus of Geographic Names® Online and Google Maps. 

Each of these datasets has its own set of limitations. The original source of consulted NHGIS data is the U.S. Census. U.S. Marshals conducted the 1860 census and sought to record accurate information as census data determined each state’s number of Congressional representatives. Still, the census ultimately relied on humans collecting self-reported data. A tired marshal may have skipped certain neighborhoods and Americans may have disclosed vague or inaccurate answers. There is no way to calculate a percent error for the U.S. Census. County borders—drawn by U.S. geological survey teams—are much more reliable, although these borders changed during the war and OMAM does not account for such changes.10

UNL’s process of “digitizing historical maps and capturing the [railroad] line data from them resulted in wide variation and inaccuracies.” Historical maps “often contained never completed roads and projected lines and towns.” Consequently, UNL cross-referenced data from multiple source materials. However, these were usually drawn at different scales, making their integration problematic. To counter these difficulties, the research team created a five-step quality control process to ensure the most accurate representation of railroad lines possible. In addition, OMAM does not account for changes in the railroad system during the war—the miles of new track continually laid by railroad companies or both armies’ destruction of railroads for logistical purposes. (Notably, these challenges explain why OMAM’s map does not contain road systems. Although it would be possible to build a map of Civil War road systems from sources such as The Official Military Atlas of the Civil War, only a separate research project solely focused on building such a map could do so accurately.)11
A screenshot of UNL’s “Railroads and the Making of Modern America.
Accurate representation of nineteenth-century river systems suffers from both natural and man-made changes to waterways over time. Floods, erosion, damming, and straightening all altered the course of rivers since the Civil War. Jeremy Atack’s navigable river system pays particular attention to historical political boundaries—usually influenced by natural barriers such as waterways—and rivers regularly navigated by steamboats throughout the nineteenth century. Atack’s river lines most likely depict waterways utilized by the Union and Confederate militaries. I consulted Natural Earth’s river data only when necessary (Natural Earth’s data represents a simplified and modern version of America’s river systems).12

04

Methods

This section describes the datafication processes used in OMAM—transforming primary source material into database categories and subsequent map symbology. This procedure varied for each of the three elements depicted on OMAM’s digital map (the Union army, instances of guerrilla violence, and guerrillas’ domestic supply line). Most important in these descriptions are the decisions I made when converting primary source text to coded information in databases. Marrying historical source’s diverse psychological motives, controversial definitions, cryptic messages, and incomplete evidence with computer software’s calculated and rigid logic can feel like fitting a square peg in a round hole. Consequently, the historian who quantifies, measures, and maps subjective evidence introduces a new layer of human imperfection with each decision they make; how I datafied evidence and the information I chose to map versus the information I left unmapped says something about my own biases and desires. In disclosing these decisions, I hope to improve upon not only our interpretation of guerrilla warfare, but also our methods for collecting, preserving, and analyzing the past.
guerrilla 7,305
guerilla 72
guerrila 8
irregular 1,663
bushwhack 2,715
jayhawk 391
brigand 85
bandit 102
insurgent 725
infest 714
maraud 1,161
southern sympathizer 55
sympathizer 624
disloyal 3,091
aid and abet 19
aiding 1,116
aider 390
abet 1,135
harbor 5,765

Using a CD-ROM version of the OR, I keyword-searched all 128 volumes using a list I created with the assistance of historians Matthew C. Hulbert, Patrick Lewis, and Joseph M. Beilein, Jr. That list is as follows, with the number of times each keyword appeared in the OR immediately following:

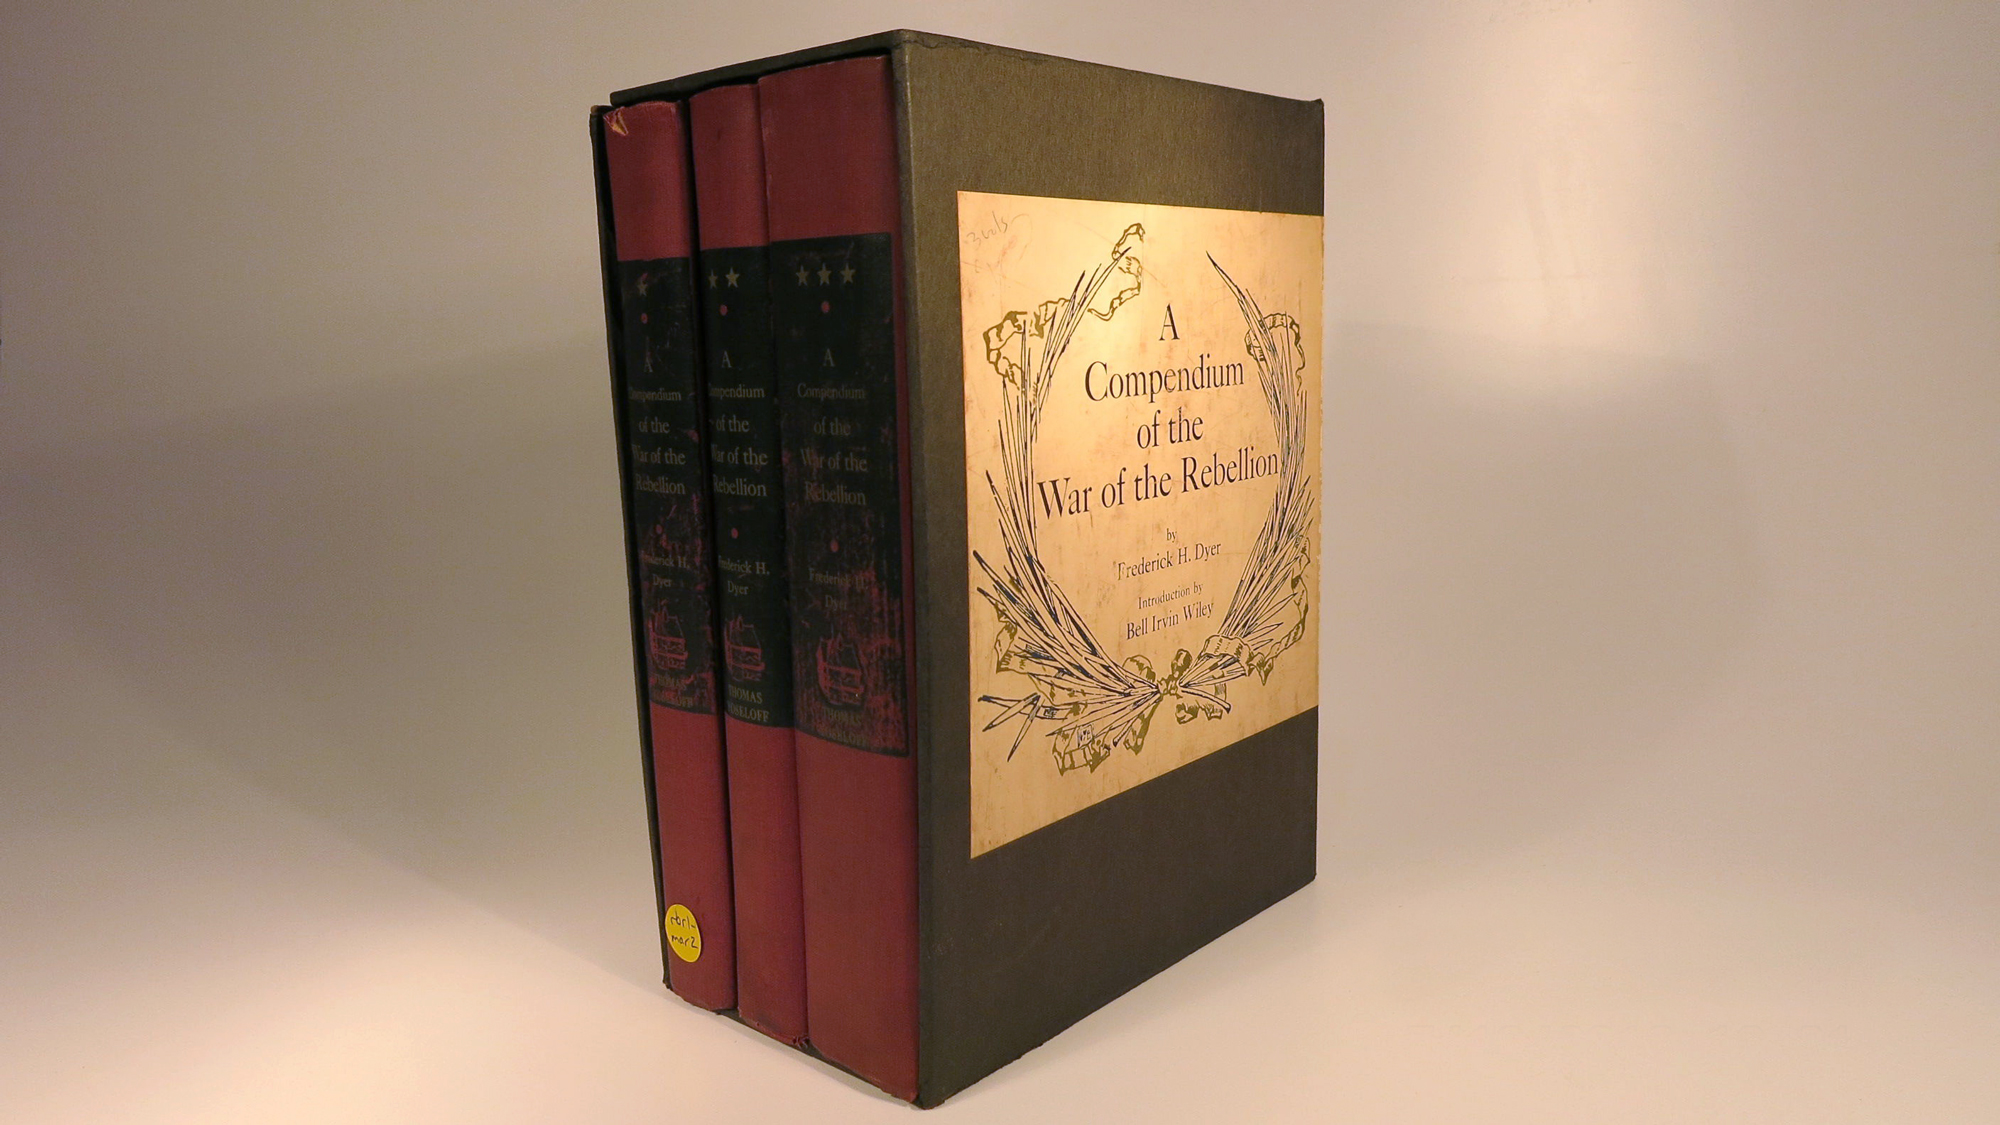
It is important to note that keywords related to Frederick Dyer’s language for the Union’s tactics that were often irregular—scout (23,581); recon (13,017); expedition (19,277)—returned so many hits that only a separate project dedicated to mapping the Union’s company-level movements (and cross-checking Dyer’s Compendium to ensure no repeated information) could adequately map them. I did catalogue instances of these Union movements when they appeared in documents associated with the above list.

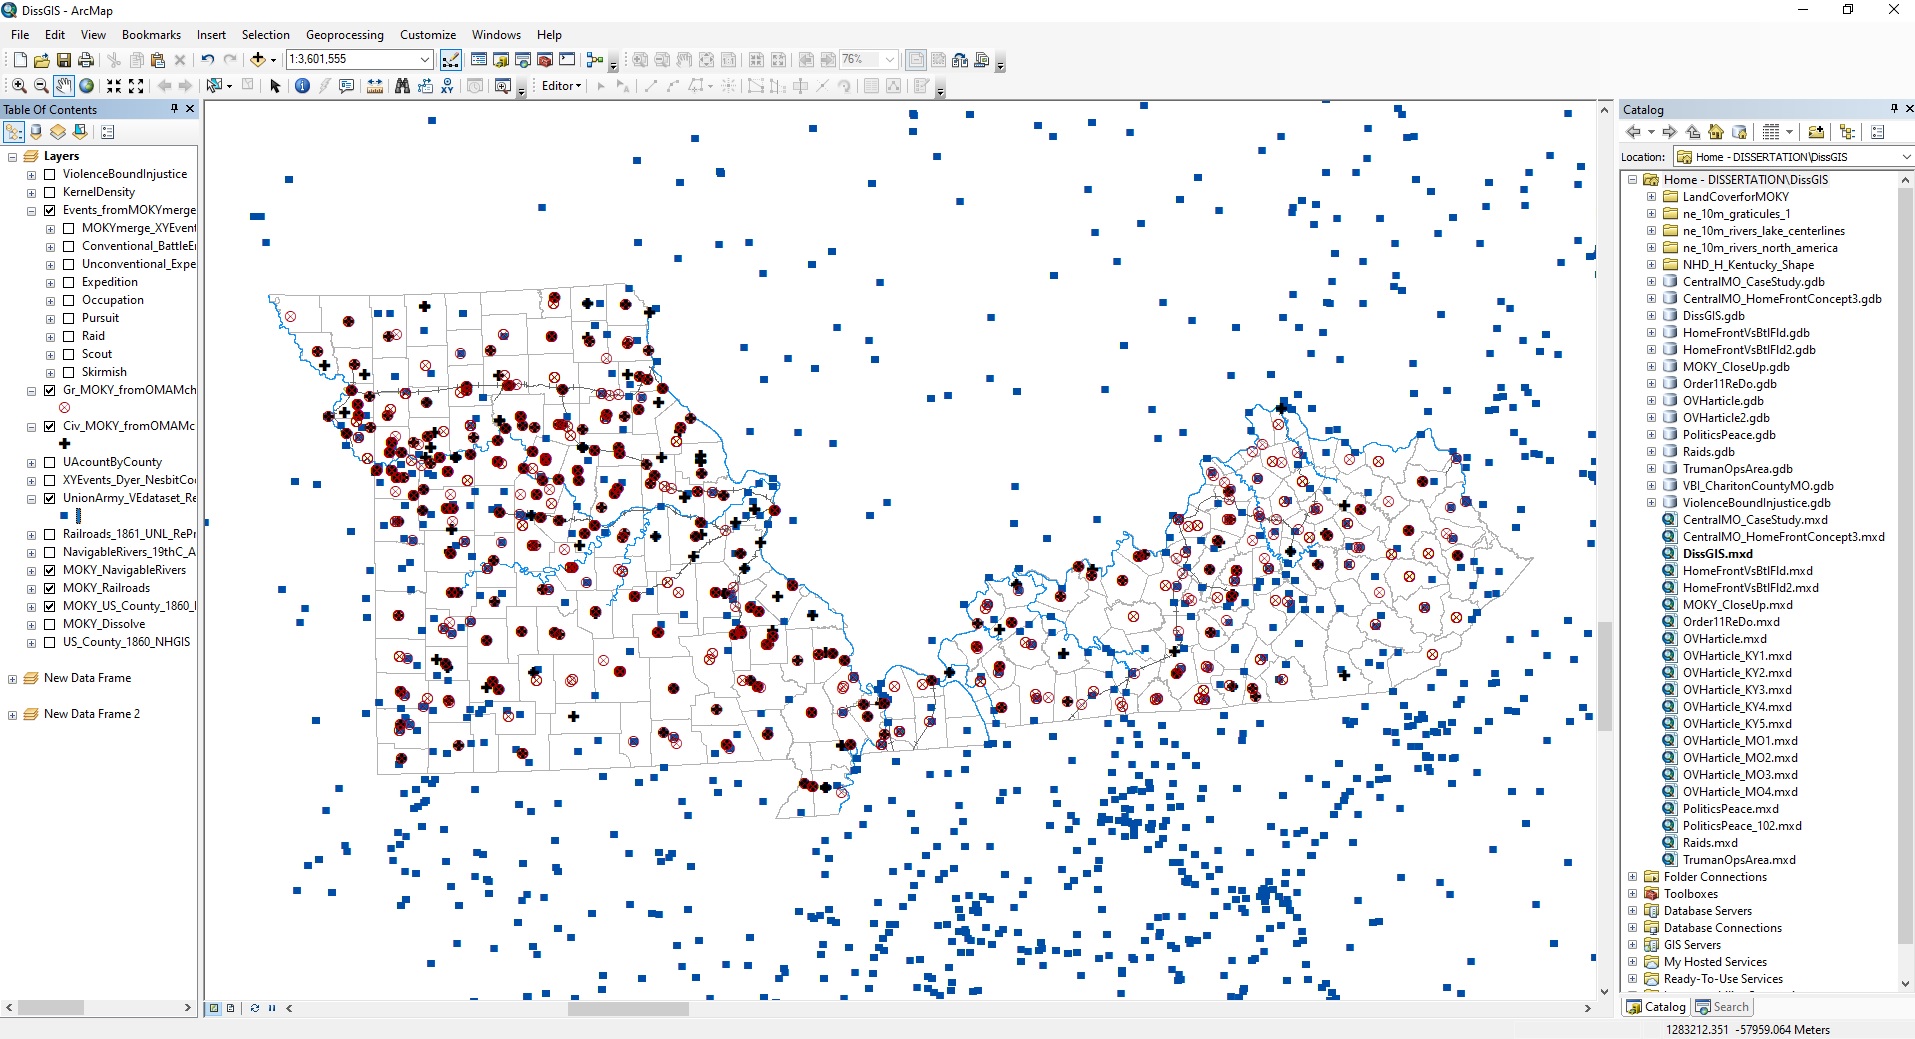
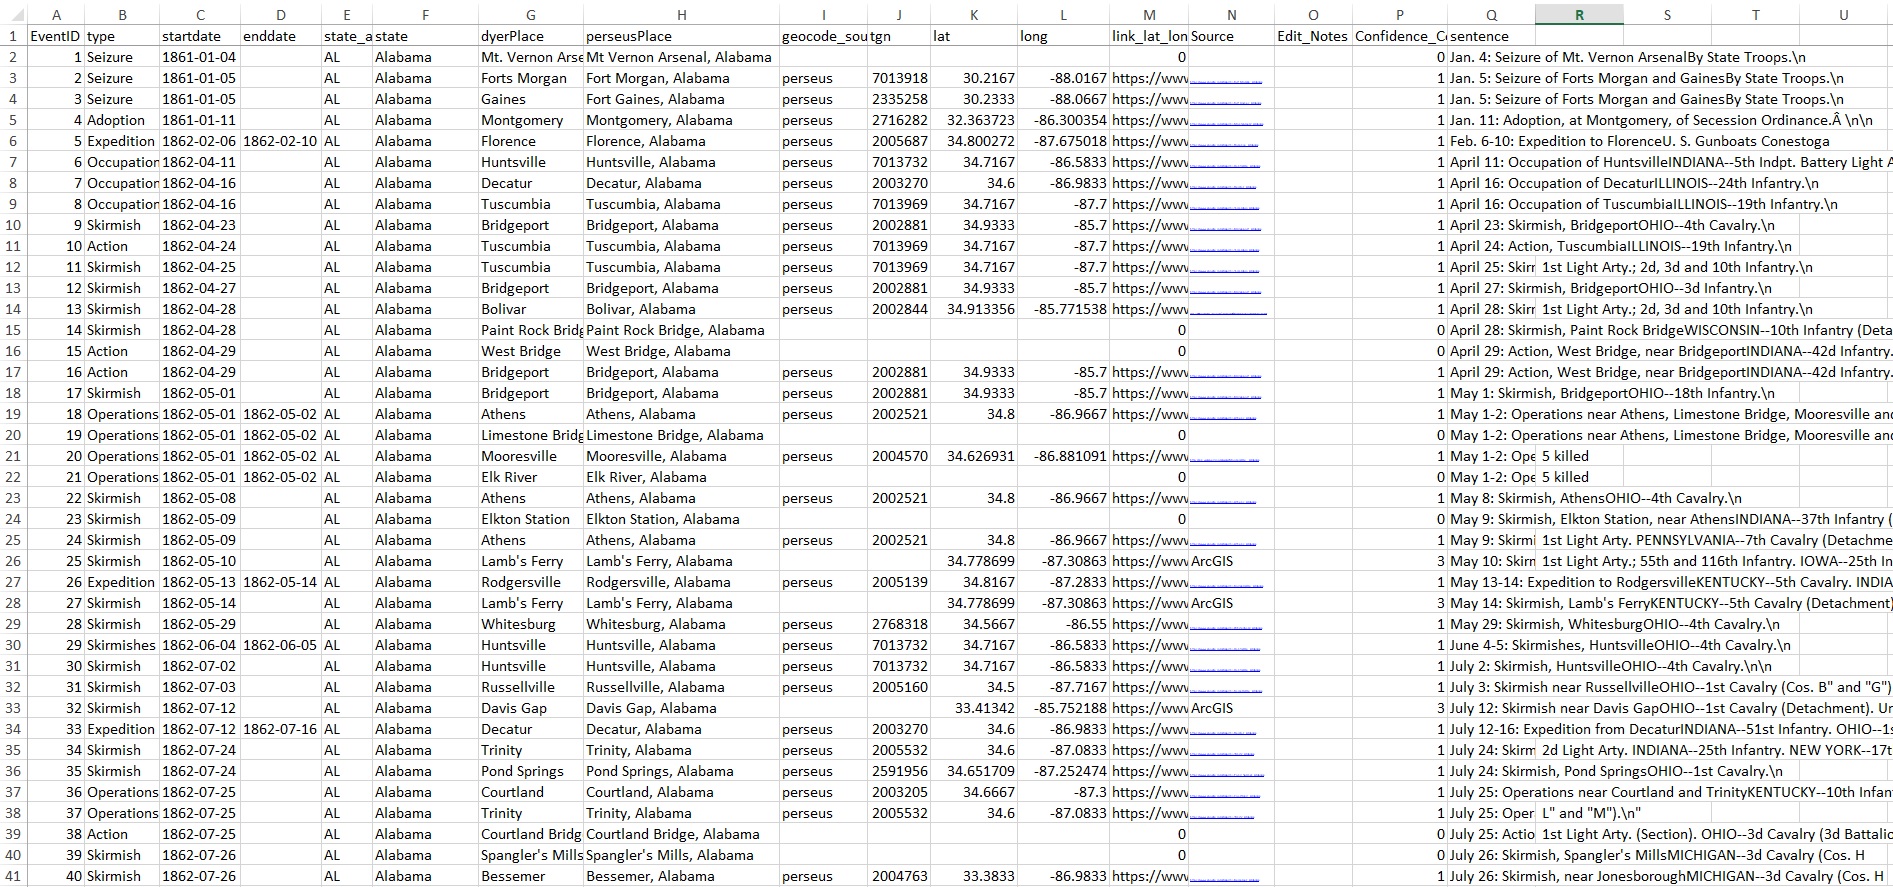
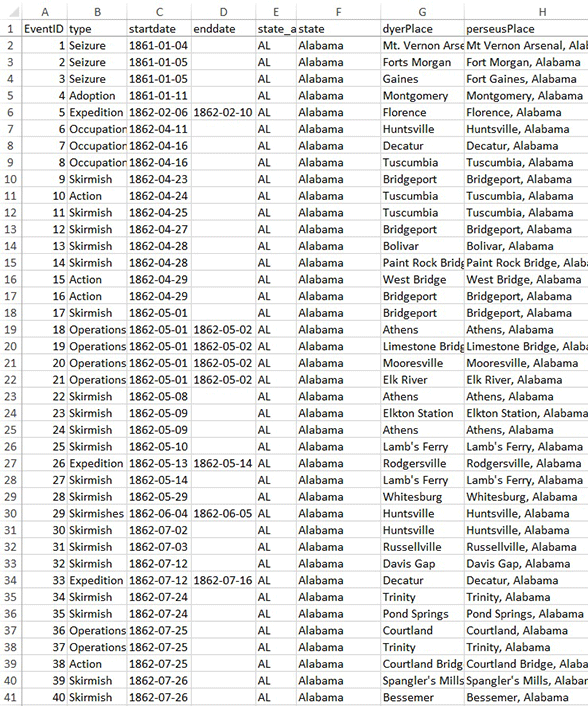
I then began the two-step process of datafication. First, using physical volumes of the OR, I read the documents associated with these keyword searches. Next, I indexed any instances of guerrilla violence, civilian aid, or Union army activity, by necessarily manipulating that evidence to fit in a database. What follows is an explanation of that process and a screenshot of the actual database.

Below: The datafication process: from original source, to transcription, to indexing data into a database, to the mapping software.
1)
Because each document usually contained multiple instances of violence or aid, each row in the database represents one instance of violence, one instance of aiding guerrillas, or one instance of Union army activity.
2)
Each row contains a unique identifier (‘uniqueid’), specific only to the OMAM dataset, for organizational purposes.
Due to the ambiguous and incomplete nature of historical records, I kept track of space and time in multiple ways:
3)
Concerning time, sometimes an event occurred on a single day (categorized under ‘date’). Often, events happened over a span of several days, weeks, or even months (categorized by ‘start_date’ and ‘end_date’). Sometimes documents were less precise, simply stating “guerrillas have devastated this county,” without specifying when guerrillas did so (usually categorized with either a ‘start_date’ or ‘end_date,’ but not both).
4)
Concerning space, sometimes a document detailed location down to the city-level (categorized by ‘city’ along with ‘lat’ and ‘long,’ short for latitude and longitude). More frequently, documents simply mentioned the county in which guerrillas operated (categorized by ‘county’ along with ‘county_lat’ and ‘county_long’). Other times, documents only described a region or mentioned a state (categorized by ‘place_descriptor’ and ‘state’). With the expertise of GeoScience and Computer Science students at Middle Tennessee State University, we devised several ways to visualize these gray areas in space—all symbolized with transparent geometry as opposed to solid points. These approximations included using a county’s central point for coordinates or creating rough lines or polygons where an event likely occurred. When drawing conclusions during analysis, I, of course, separated positively-identified coordinates from approximated ones. 
5)
For latitudes and longitudes, I used the Getty Thesaurus of Geographic Names Online or Google Maps.
6)
To describe what actually happened in each line of data, I used a simple classification system of ‘actor,’ ‘action,’ and ‘acted upon.’ For example, if a guerrilla shot and killed a member of the Union army, the actor is a guerrilla, the action is lethal violence, and the guerrilla acted upon the Union army. The ‘action’ column also has a sub column (‘action_sub1’) to include more descriptive information.
7)
Lastly, there are columns for citation information and personal notes.
A screenshot of OMAM's database.
Step six in this process—classifying primary evidence—determines how OMAM’s map will symbolize data, how much of that data can be accurately represented, and is also most susceptible to the historian imprinting their own biases onto the data. To address this crucial step, I will present my classification system in full, along with its known inadequacies.

The following visualization is organized as follows:
I. ACTOR
        A. ACTION
                1. ACTION_SUB
                        i. ACTED_UPON

Categorization of Guerrilla Violence

I. Ugr or Cgr – reports of guerrilla activity (U = pro-Union, C = pro-Confederate)
A.
lethal – lethal violence against human(s)
1.
tactical – recognized military tactics (such raid, ambush)
2.
murder – assassination/hanging/execution
B.
nonlethal – nonlethal aggression against human(s)
1.
assault – includes physical harm
2.
threat – violent and nonviolent threats/intimidation
3.
prisoner – kidnap, hostage/prisoner taking
4.
guide – forced assistance
C.
propertyDamage – rob/destroy property
D.
terror – vague references to guerrilla activity (ex: “guerrilla infested the country”)
i.
ua – guerrilla targets Union army
ii.
ca – Confederate army
iii.
Ulocal – local representative of Union (Home Guard, militia, etc.)
iv.
civ – civilian

Categorization of Union Army Presence

I. ua or Ulocal – report on presence of Union army (ua = Union army; Ulocal = local representative of Union)
A.
service – no descriptor exists in OR
B.
[conventionalDescriptor] – same language used by Dyer (scout, raid, expedition, etc.)
1.
lethal – lethal violence against human(s)
2.
nonlethal – nonlethal aggression against human(s)
3.
capture – prisoner-taking
C.
pacification – any action aimed at “eliminating the guerrilla’s base of support”
1.
banish – remove from a city/military district/state
2.
incarcerate – arrest and/or imprison
3.
money – fine/issue bond/issue county assessment
4.
loyaltyOath – assess loyalty oath
5.
threat – violent and nonviolent threats/intimidation
6.
propertyDamage – rob/destroy nonhuman property
7.
humanTheft – removing blacks from property
8.
lethal – lethal violence against human(s)
i.
civ – target civilian(s)
ii.
Cgr – target guerrilla(s)

Categorization of Guerrillas’ Domestic Supply Line

I. ua or Ulocal – report on presence of Union army (ua = Union army; Ulocal = local representative of Union)
A.
service – no descriptor exists in OR
B.
[conventionalDescriptor] – same language used by Dyer (scout, raid, expedition, etc.)
1.
lethal – lethal violence against human(s)
2.
nonlethal – nonlethal aggression against human(s)
3.
capture – prisoner-taking
C.
pacification – any action aimed at “eliminating the guerrilla’s base of support”13
1.
banish – remove from a city/military district/state
2.
incarcerate – arrest and/or imprison
3.
money – fine/issue bond/issue county assessment
4.
loyaltyOath – assess loyalty oath
5.
threat – violent and nonviolent threats/intimidation
6.
propertyDamage – rob/destroy nonhuman property
7.
humanTheft – removing blacks from property
8.
lethal – lethal violence against human(s)
i.
civ – target civilian(s)
ii.
Cgr – target guerrilla(s)

Difficulties in Assigning Descriptors

The descriptor combinations listed in the above table are the most common; however, others did exist. For example, on rare occasions, civilians killed other civilians. In this example, the actor is a civilian (civ), the action is lethal violence (lethal), and the civilian acted upon another civilian (civ). In these instances, the classification system’s flexibility encompassed the guerrilla conflict’s variety of violence. Still, the above combinations make up a vast majority of the OMAM database. 

Other situations forced me to make a judgment call between descriptors. One of the hardest things to differentiate was guerrillas’ targets. There is a gray area between guerrillas targeting the Union army and guerrillas targeting civilians because of organized “strong-arm Union bands.” Unionist civilians composed these sometimes-sanctioned, sometimes-extralegal militia units. Historian Michael Fellman described them as “well-led ‘mobs’ … [that] killed and burned out” southern sympathizers and even overthrew “civic governments and circuit courts.” Often, guerrillas targeted such militia units as an extension of the Union army. The problem lies in deciding whether or not to classify members of such groups as the Union army or as a civilian—I chose to categorize situations in this gray area as guerrillas targeting civilians. This decision allows me to silence any accusations of being an apologist for guerrillas’ brutality. Guerrillas also targeted furloughed or discharged soldiers. I categorized these targets as the Union army.14

Similarly, it was difficult to distinguish a perpetrator of violence as a guerrilla versus a civilian because guerrilla bands were composed of, and supported by, civilians. They’re one and the same. Sometimes guerrilla bands sustained steady membership and obeyed designated leaders. We know a lot of these guerrillas’ names. Other times, civilians capitalized on the confusion of guerrilla war to wage personal vendettas or loot without actually taking to the bush for an extended period of time. This conundrum is part of guerrillas’ tactics to confuse their opponents; an army cannot destroy an unidentifiable enemy. As such, I relied on the primary document’s language to make this decision. If the Union army or civilians called perpetrators of violence guerrillas, I categorized them as guerrillas. If the Union army or civilians noted acts of violence or property destruction without naming a perpetrator, I categorized the perpetrator as a civilian.15

Another difficult choice was whether or not to classify a civilian as comprising part of guerrillas’ domestic supply line. It was often impossible to ascertain civilian’s genuine loyalties. (There is an entire subfield of Civil War history dedicated to this issue.) When guerrillas entered a community, local civilians responded in numerous ways; some were forced to give aid or information, others offered these things freely. Some lied about their true loyalties to ensure their survival; others stood up for their beliefs and paid the ultimate price. Some joined the guerrillas for the day and exacted personal vendettas against their neighbors; others assembled with the local Unionist militia and openly fought guerrillas. Most complied with the wishes of whatever power occupied their community at any given time—be it guerrillas or the Union army—and kept their mouths shut in order to save their family and farms. I chose to only “positively” condemn a civilian for assisting guerrillas if the Union army built a watertight case against a suspected abettor, complete with eyewitness testimony and/or confessions. This decision surely underestimates the number of civilians composing guerrillas’ domestic supply line, but does not exaggerate the guerrilla war’s extent.16

05

Credits, Contributors, Builders

My name is Andrew Fialka. I am an Assistant Professor at Middle Tennessee State University where I teach Civil War and American history and conduct research on guerrilla war and spatial methodologies. I also work at the University of Georgia’s Center for Virtual History on multiple digital humanities projects, including Fugitive Federals: A Digital Humanities Investigation of Escaped Union Prisoners (2018) and CSI: Dixie: The View from the American South’s County Coroners’ Offices, 1800-1900 (2014). In 2012, I worked as a seasonal Park Ranger at the Fredericksburg & Spotsylvania National Military Park
The current version of the project (4.0) is under construction at Middle Tennessee State University using a kaleidoscope of funding, student labor, and ITD support.

Necessary funding comes from the Tennessee Civil War National Heritage Area. These funds paid a GeoScience graduate student and Computer Science undergraduate to oversee project development. Additionally, funding went to host the project’s website and database on MTSU server space.

Ian Rust (MTSU Computer Science undergraduate student) developed the interactive map and site using ArcGIS javascript API and continues to oversee connecting backend data to frontend visualization on the web.  

Brandon Sadley (MTSU GeoScience graduate student) assisted in designing and converting geometry types in the project database, built the project base map from the Civil War Military Atlas, and assisted in spatial analyses. 

The project also utilizes undergraduate labor in conjunction with the MTSU Computer Science department’s required class CSCI 4700/5700 – Software Engineering, taught by Dr. Medha Sarkar. Students received class credit to work on the project’s database design and website development. Contributors from Spring 2020 included Sam Hollingsworth, Paul Myers, Andrew Bowman, Girgis Shihataa, Ian Seal, and Cruz Jean. Contributors from Fall 2019 included Ian Rust, Ryan Butler, Ebosehon Imeokparia, and Sai Manoj Nelavalli.

I would like to thank the following for helping me develop the project’s database and hosting design: Henrique Momm, Jeremy Aber, Alan Franklin, Jimmy Williams, and Michael Barton.
 
The project is hosted on MTSU’s server using a virtual machine. It utilizes Microsoft SQL Server 2019, Windows Server OS, and ArcGIS for Server.

The project is dually-hosted by the Information Technology Outreach Services group at the Carl Vinson Institute of the University of Georgia. Of Methods and Madness is powered by the ESRI suite of software products, especially ArcGIS. The project is presented with the support of the Willson Center for Humanities and the Arts at the University of Georgia, in affiliation with the Center for Virtual History.

Of Methods and Madness logo designed and created by Rob Bratney.

Previous Versions

Version 3.0 of the project culminated at the University of Georgia under research assistantships with Stephen Berry and Scott Nesbit. The project received necessary funding from a Willson Center Graduate Research Award, Willson Center Special Funding Award, UGA Graduate School Dean’s Award, Gregory Graduate Research Award, Filson Historical Society Research Fellowship, Kentucky Historical Society Research Fellowship, and Horace Montgomery Graduate Fellowship. Additionally, UGA's history department provided a licensed version of ArcGIS which I used to build the mapping component of the project. Version 3.0 is built with ESRI’s StoryMap software on ArcGIS Online. 

Versions 1.0 and 2.0 of the project culminated at West Virginia University. WVU’s history department provided funding for a research trip to Columbia, Missouri, incorporated Geographic Information Systems coursework into their department’s bylaws, and recognized a partly-digital Master’s thesis as legitimate for degree completion.

06

Project History

This website represents version 4.0 of the project. I built versions 1.0 through 3.0 under trying conditions—two worth mentioning here. First, I enrolled in one GIS class as a master’s student, but the rest of my knowledge concerning the necessary technology for this project came almost exclusively from YouTube tutorials. Second, all of the grants I won as a graduate student contributed to research trips, meaning I built all of the project websites by myself with no money or proper training.17 (Excellent open-source software for building websites exists, but we all know free isn’t free—they come with harsh limitations, especially for a historian trying to adapt technology built with a different disciplines’ needs in mind.) 

Below are descriptions of each version of the project, with links to those projects, themselves.

Version 1.0

Version 1.0, built as a master’s student at West Virginia University, was a disaster. I took the Geography Department’s entry-level class on ArcGIS, then ditched that software entirely after realizing its time function was a bit clunky. This was a huge mistake. As I learned years later from the University of Georgia’s GIS Librarian, Meagan Duever, “time is hard.” Truth. I soon learned that no digital mapping platform has a less-than-clunky time function. 

I decided to learn a new piece of software—Neatline, a plug-in for Omeka, which is a “free, flexible, and open source web-publishing platform”—with no training, while simultaneously undergoing the data entry process, a semester before I was slated to defend my thesis, with a broken laptop and no money to replace it.18

To be sure, someone experienced with Neatline and/or Omeka will probably be able to offer easy solutions to the following problems. I am certain most, if not all, of these issues resulted from operator error. Still, this proves my initial point about trying conditions: any history graduate student trying to learn multiple software platforms in addition to their coursework, research, and writing loads will inevitably face similar circumstances. 

A comedy of errors ensued. At the time (2013), Omeka either only ran, or best ran, I can’t remember which, on a Linux operating system. I had no suitable computer, and the WVU geography lab’s computers ran on Windows. Just to access Neatline, I had to alter the boot sequence of the geography lab’s computers to read from their USB port, then booted them from an external hard drive loaded with a Linux operating system (which took me two days to install with help from a local bassist I played music with who happened to have a Computer Science degree). This workaround sufficiently allowed me to pair the geography lab’s computers with Neatline’s necessary operating system, but drastically reduced the computer’s processing speed. As a result, inputting mass quantities of evidence into Neatline became painstakingly slow as the program constantly crashed. 

Then there were the plug-ins. So many plug-ins (Neatline itself being a plug-in). And each plug-in layered another set of limitations on visualizing the project’s data. For example, the ‘CSV Import’ plug-in enabled me to upload data contained in Excel spreadsheets, but utilized Dublin Core standards for data categorization, which seriously hampered my ability to include historical nuance and ambiguity.
19 A ‘Neatline Maps’ plug-in was necessary to display useful indicators such as county lines, topographic identifiers, and historical demarcations. Alas, I never did figure out how to wed downloaded shapefiles of historic transportation networks—such as the 1861 railroad system—with this plug-in. Consequently, my analysis suffered (guerrillas frequently attacked the Union army’s logistics network). 
A screenshot of my MA thesis data displayed in Neatline.
Most importantly, I could not simultaneously view or edit large quantities of inputted information through an attribute table. The data for each event on the map was organized and accessible separately, meaning I had to make sweeping analyses and changes one case at a time (for example, if I wanted to change the symbology for Union occupational forces on the map from a red square to a blue triangle, I had to do so one point at a time, hundreds of times). 

The result of all this? Most embarrassingly, my master’s thesis contains dozens of footnotes with broken links referencing a Neatline project that was never publically-accessible and no longer exists. This is professionally unacceptable and I’ve had to live with that. But I did learn the hard way that ArcGIS—clunky time function and all—was the most powerful spatial analytics program available to me. 
A screenshot of Version 2.0 of this project

Version 2.0

Despite its many flaws, I presented this project at multiple academic conferences and word about my spatial methodology and its resulting conclusions confirmed some of the more qualitative arguments coming from my colleagues in the Civil War guerrilla field. Joseph M. Beilein, Jr. and Matthew C. Hulbert approached me about publishing my findings in an upcoming edited collection.

While the text that became my chapter in Beilein & Hulbert’s Civil War Guerrilla (2015) went through the history profession’s normal peer-review processes, those processes did not (and still do not) exist for digital history projects. Therefore, the publication of partly-textual, partly-digital scholarship brought about an awkward problem: how to cite a changing digital database in non-changing text? Historians must be transparent by showing the source material that led to their conclusions, but this project’s source material was organized in a dynamic database that still didn’t have a home online. 

I opted to convert my project’s Neatline component back into ArcGIS and publish my data in a free website using ArcGIS Online—a cloud-based service for hosting interactive maps (an explanation of how to access that data is described in Version 3.0).20 At nearly the same time, I was fortunate enough to be accepted into the University of Georgia’s PhD program, where I lucked upon a home for this new, ArcGIS Online website: UGA’s Center for Virtual History. 

The result was less than perfect (from footnotes in my chapter from Civil War Guerrilla): “Citations … [from Version 1.0] refer to material from Neatline databases that are part of my master’s thesis, Fialka, “Reassessing Guerrillas”; the URLs are item identifiers, not publicly accessible website addresses. These materials will be made publically available at … the University of Georgia’s Center for Virtual History[, which] currently hosts an expanding version of the datasets and maps used in this essay.”21 The “materials” referenced in those footnotes are located at the Version 2.0 link. 

Ultimately, Version 2.0 was quick and dirty—its existence rushed by my desire to take advantage of a publication opportunity (a huge boost on the increasingly competitive job market) and to meet my profession’s standards of transparency. I committed myself to building a proper website as soon as possible.
A screenshot of Version 2.0 of this project

Version 3.0

While a PhD student at UGA, I revamped the OMAM website built using ArcGIS Online into the StoryMap link above. Version 3.0 was an improvement on numerous levels: the text encompassed updated conclusions from my dissertation research, the site displayed several static maps exported from ArcGIS that visualized my conclusions in a clear way, my data and research methods were laid bare in their most transparent form ever, and the database was publically-accessible. 

Two flaws remained. First, while the text and static maps reflected conclusions from my dissertation research (mostly conducted in Kentucky), the Interactive Map still only includes information from my master’s thesis. I chose not to rebuild an interactive map until I could do so properly—with grant money to hire Computer Science and GeoScience expertise. 

Second, while the database from my master’s thesis was publically-accessible, actually doing this was still wrought with difficulties. In order to have the database truly available in a user-friendly way, I would have to allow the user to direct download the Excel file where I conduct data entry. I do not want to do this for professional reasons: I am still updating said database and building a career by drawing conclusions from it. As a junior faculty member, I cannot afford to allow a senior faculty member access to my research, as they may be able to publish conclusions from it before I can. Instead, I allow the user to view the database within the Interactive Map’s menu. Directions to do so are displayed in the YouTube tutorial posted on the website. In addition, there are step-by-step instructions in this footnote.22
  1. Antoine-Henri Jomini, The Art of War (Westport, Connecticut: Greenwood Press, 1971 [original 1862]), 29; Carl von Clausewitz, On War (Washington, D.C.: Combat Forces Press, 1943 [original 1832]), 3-4, 53-55, 547-462.

  2. The War of the Rebellion: A Compilation of the Official Records of the Union and the Confederate Army, 128 vols. (Washington, D.C., 1880-1902).

  3. Yael A. Sternhell, “The Afterlives of a Confederate Archive: Civil War Documents and the Making of Sectional Reconciliation,” Journal of American History 102, no. 4 (March 2016): 1026, 1044, 1048-1049.

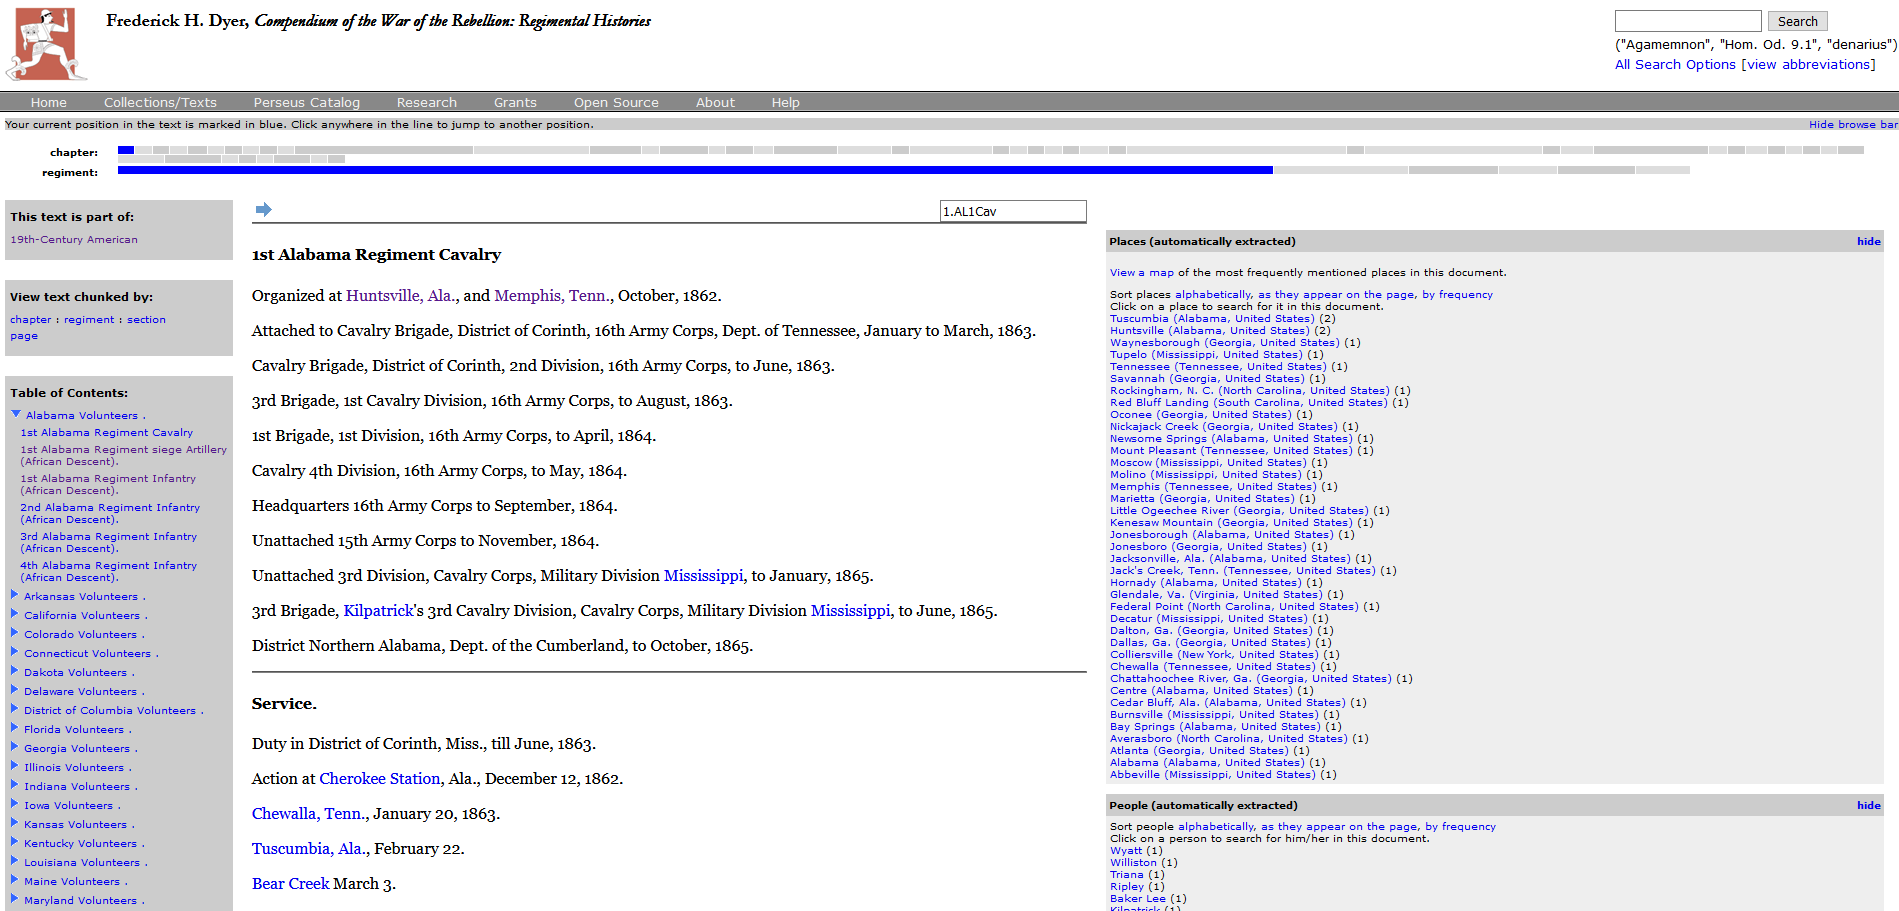
  4. Frederick H. Dyer, A Compendium of the War of the Rebellion (New York: Sagamore Press, 1908). Quotes from Bell Irvin Wiley’s introduction to the 1959 edition [unnumbered pages]. The unused Volume II is a “Name Index of Commands” detailing every Union officer, their rank(s), the dates they held said ranks, and their regiment’s associated brigade, division, corps, and army.

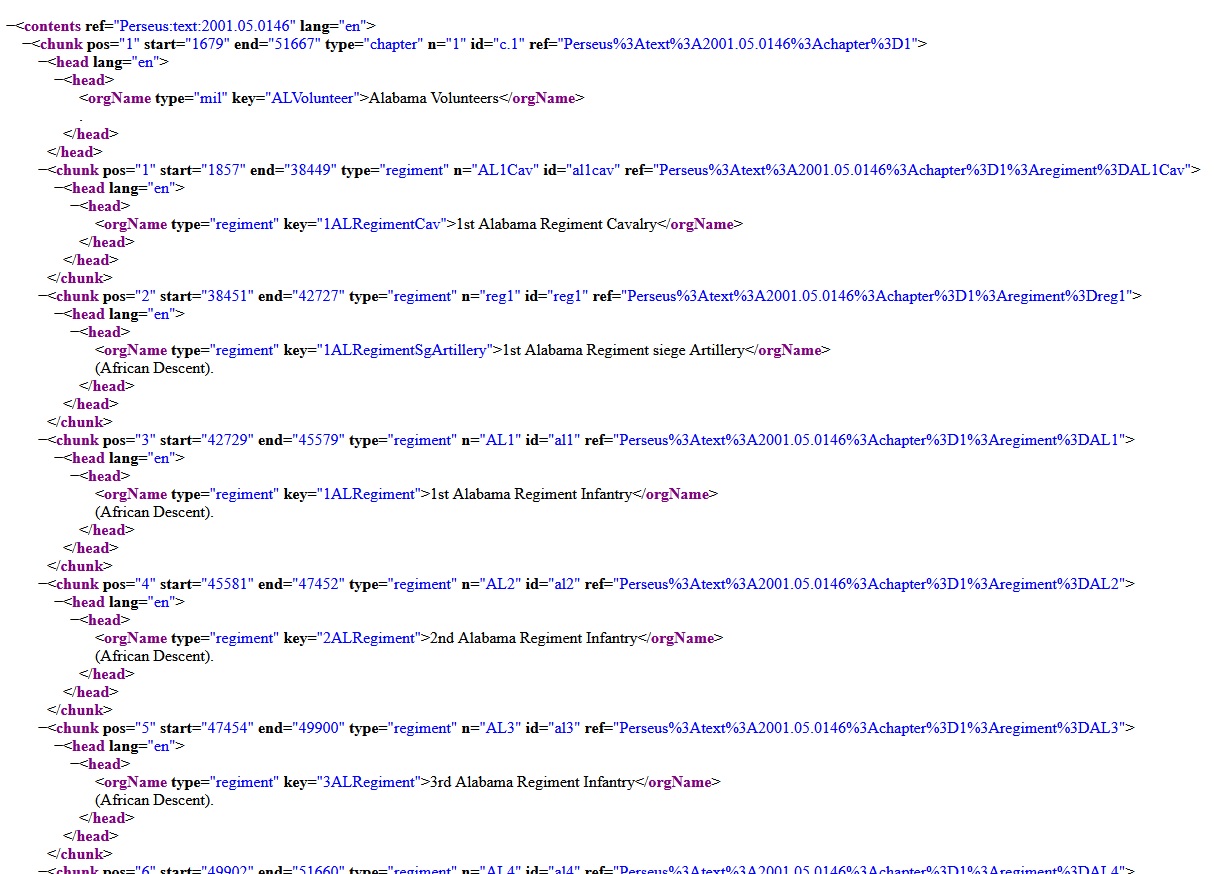
  5. Gregory R. Crane, “Perseus Digital Library,” Tufts University, http://www.perseus.tufts.edu/hopper/ (accessed March 20, 2020).

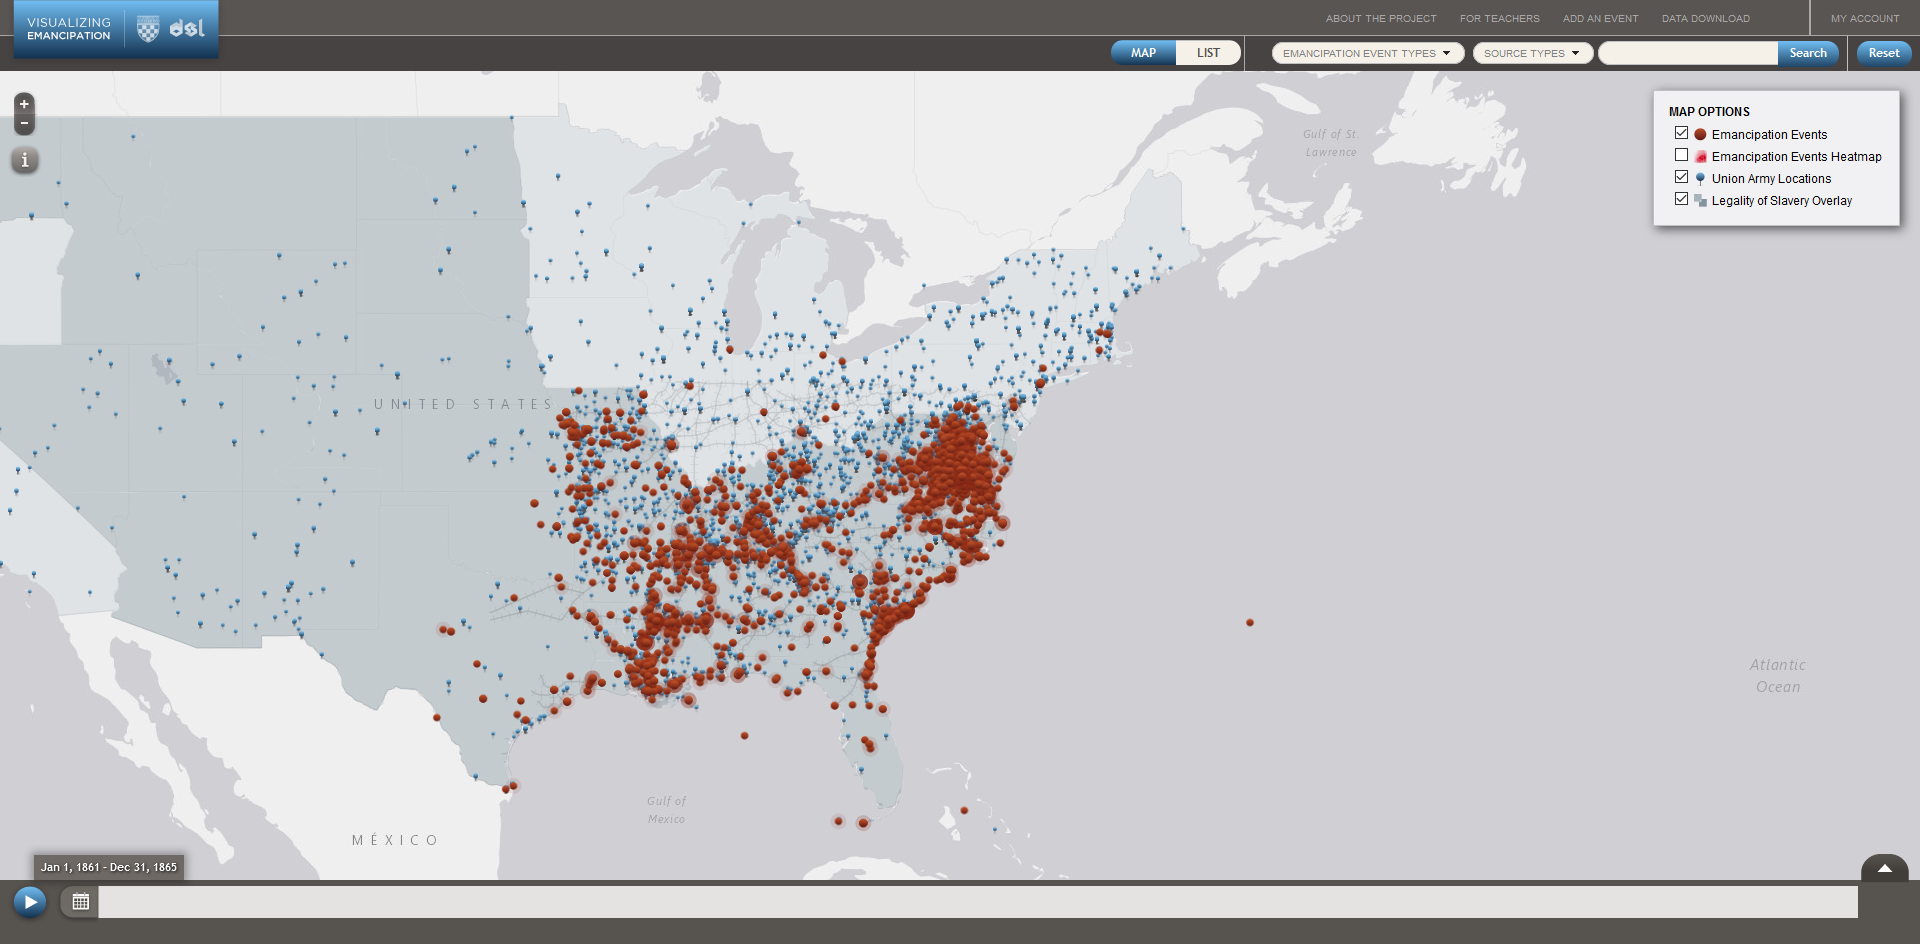
  6. The University of Richmond, “Digital Scholarship Lab,” Boatwright Memorial Library, Visualizing Emancipation, http://dsl.richmond.edu/emancipation/ (accessed March 20, 2020). “Visualizing Emancipation” credits the following for transforming the digitized text of Dyer’s Compendium into mappable data: “Chris Kemp has provided help in working with xml-encoded texts and their transformations, and played a significant role in transforming the Union army information from textual description to mapped data. … Alex Wan helped clean U.S. army data that had been generated algorithmically.” See http://dsl.richmond.edu/emancipation/credits/ (accessed March 20, 2020).

  7. Dyer actually used 154 different terms to describe the Union army’s movement, but I removed misspellings, different tenses of the same verbs, and plurals of the same verb. I used nineteenth-century United State military manuals to better understand Dyer’s terminology. See, William Duane, A Military Dictionary, Or, Explanation of the Several Systems of Discipline of Different Kinds of Troops, Infantry, Artillery, and Cavalry; The Principles of Fortification, and All the Modern Improvements in the Science of Tactics: Comprising The Pocket Gunner, or Little Bombardier; the Military Regulations of the United States; the Weights, Measures, and Monies of All Nations; the Technical Terms and Phrases of the Art of War in the French Language, Particularly Adapted to the Use of the Military Institutions of the United States (Philadelphia, 1810); and Captain Lendy, Maxims, Advice and Instructions on the Art of War, or a Practical Military Guide for the Use of Soldiers of All Arms and of All Countries (New York: D. Van Nostrand, 1862).

  8. Andrew Fialka, email to Perseus Digital Library’s Managing Editor, September 25, 2017. The Perseus Digital Library used Prime Recognition for its Optical Character Recognition software. See “Prime Recognition,” http://www.primerecognition.com/ (accessed March 20, 2020).

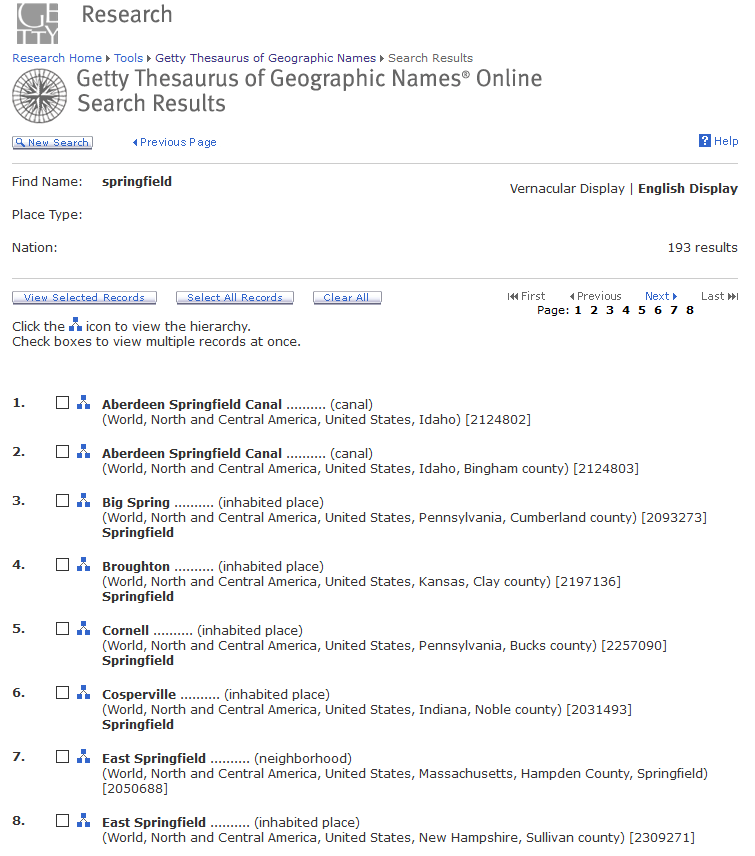
  9. The J. Paul Getty Trust, “Getty Thesaurus of Geographic Names® Online,” The Getty Research Institute, http://www.getty.edu/research/tools/
    vocabularies/tgn/index.html (accessed
    March 20, 2020). See “Methods,”
    Visualizing Emancipation, http://dsl.richmond.edu/emancipation/
    methods/ (accessed March 20, 2020). The site’s description of geotagging errors in its entirety is as follows: “errors appeared during the process of identifying placenames; some historical places
    are not listed in even the best modern
    gazetteers, while other places remained
    ambiguous to the computational models
    because they are shared by multiple locations. For more information on the digitization and data extraction process, see ***. The Digital Scholarship Lab introduced further errors in computationally pairing dates and locations. While we have caught hundreds of errors, we know that many others still remain to be corrected. We are currently looking for ways to correct remaining errors in the armies dataset.”

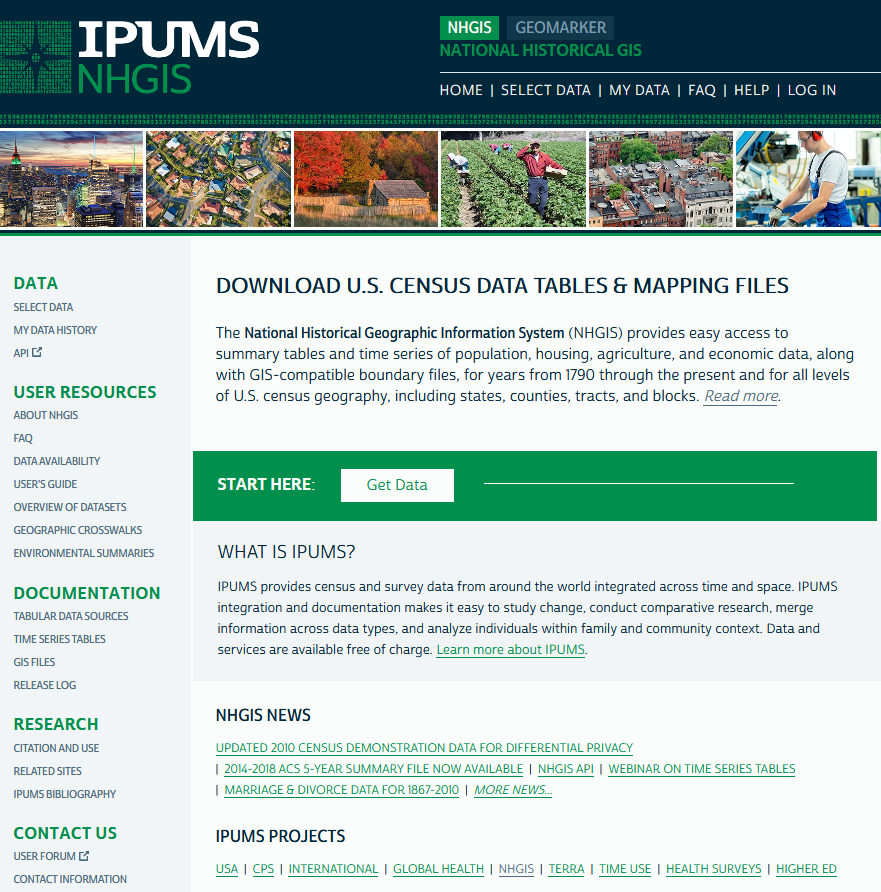
  10. For NHGIS’s description of its source
    material, see NHGIS, “What is the source of
    NHGIS data?,” Frequently Asked Questions, https://www.nhgis.org/user-resources/faq#data_source (accessed March 20, 2020) and NHGIS, “Tabular Data Sources,” https://www.nhgis.org/
    documentation/tabular-data (accessed March 20, 2020). In regards to the 1860 Census consulted for this project, research teams headed by Michael Haines, Donald Bogue, and Andrew Beveridge undertook “the arduous conversion of pre-computer-age historical data from print media to a digital, machine-readable form.” These research teams consulted secondary sources in addition to the U.S. Census, including Michael R. Haines, “Historical, Demographic, Economic, and Social Data: The United States, 1790-2002,” Inter-university Consortium for Political and Social Research Study 2896, University of Michigan, https://www.nhgis.org/
    sites/www.nhgis.org/files/histseries-icpsr02896-1790-2002.pdf (accessed March 20, 2020) and William Thorndale & William Dollarhide, Map Guide to the U.S. Federal Censuses 1790-1920 (Baltimore, MD: Genealogical Publishing Co., 1987).

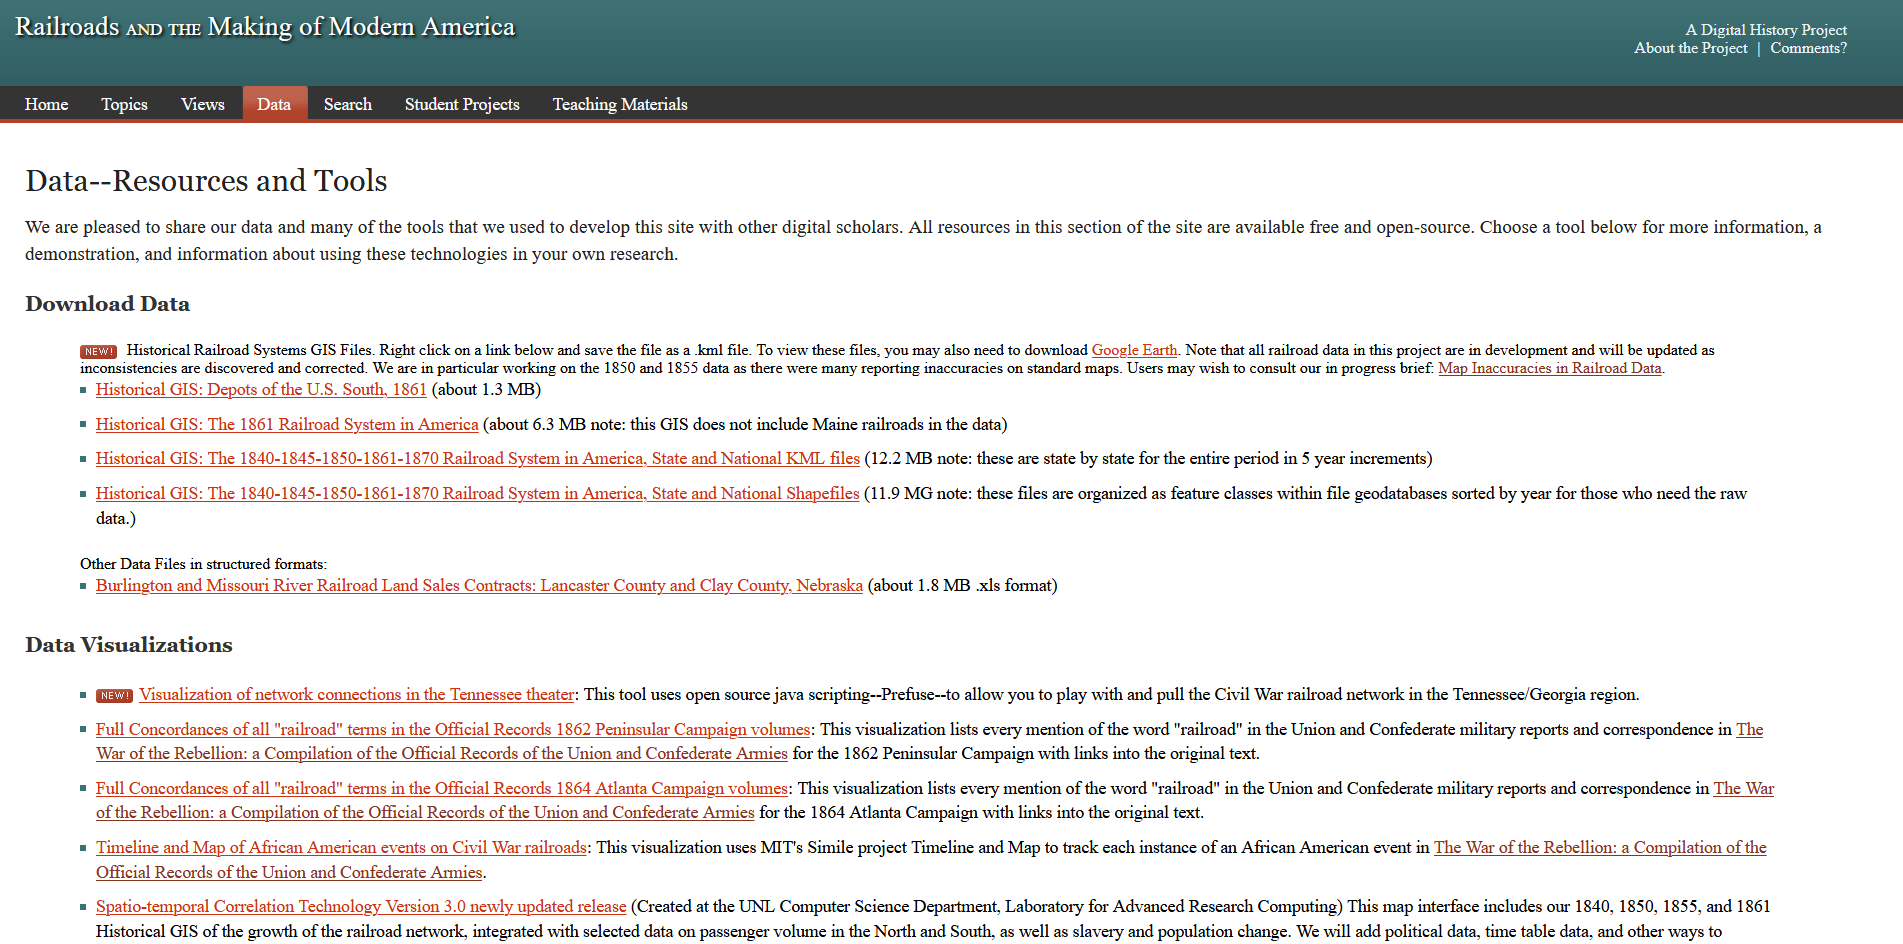
  11. See “Map Inaccuracies in Railroad Sources,” Railroads and the Making of Modern America, University of Nebraska-Lincoln, http://railroads.unl.edu/views/item/mapping (accessed March 20, 2020). Davis, George B., Leslie J. Perry, Joseph W. Kirkley, Calvin D. Cowles, & Richard Sommers, eds., The Official Military Atlas of the Civil War (New York: Gramercy Books, 1983).

  12. For a thorough discussion of issues relating
    to the creation of this dataset, see Jeremy
    Atack, “Procedures and Issues Relating to the Creation of Historical Transportation
    Shapefiles of Navigable Rivers, Canals and
    Railroads in the United States,” Vanderbilt
    University, https://my.vanderbilt.edu/
    jeremyatack/files/2015/12/Creating-Historical-Transportation-Shapefiles-of-Navigable-Rivers-Revised-December-2015.pdf (accessed March 20, 2020). Natural Earth derived their river data from World Data Bank 2 and “the North American Environmental Atlas, a collaboration of government agencies in Canada, Mexico and the United States and the trilateral Commission for Environmental Cooperation.” Natural Earth also “manually smoothed” their data. For additional information on World Data Bank 2, see Central Intelligence Agency. WORLD DATA BANK II: NORTH AMERICA, SOUTH AMERICA, EUROPE, AFRICA, ASIA. ICPSR version. Washington, DC: Central Intelligence Agency, Office of Geographic and Cartographic Research [producer], 1977. Ann Arbor, MI: Inter-university Consortium for Political and Social Research [distributor], 2000. https://doi.org/10.3886/ICPSR08376.v1 (accessed March 20, 2020).

  13. Robert R. Mackey, The Uncivil War: Irregular Warfare in the Upper South, 1861-1865 (Norman: University of Oklahoma Press, 2005), 13-14. Mackey’s work is one of the most useful for delineating definitions for guerrilla activity.

  14. Fellman, Inside War, 238.

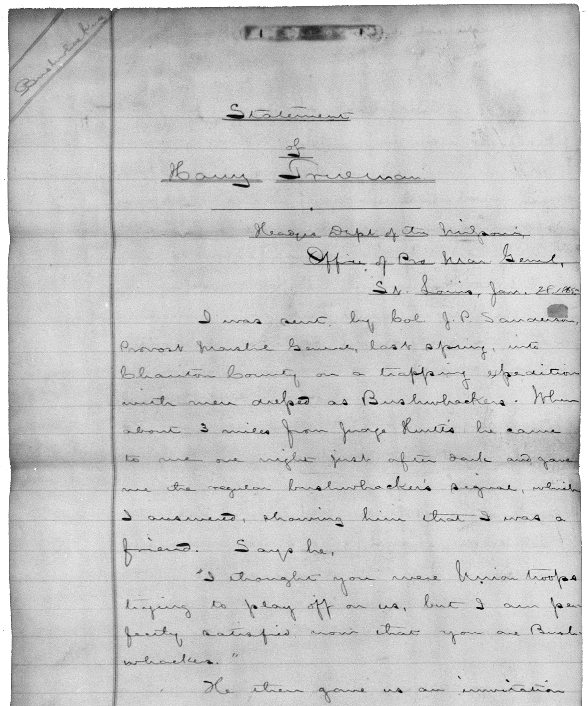
  15. Many can be found in, J. C. Eakin and D. R. Hale, Branded as Rebels: A List of Bushwhackers, Guerrillas, Partisan Rangers, Confederates and Southern Sympathizers from Missouri During the War Years. (Lee’s Summit, Missouri, 1995). In addition, Richard Brownlee’s Gray Ghosts of the Confederacy includes an appendix of “known members of Quantrill’s, Anderson’s and Todd’s guerrillas.” The list includes 340 names and when the guerrillas died. See, Richard Brownlee, Gray Ghosts of the Confederacy: Guerrilla Warfare in the West, 1861-1865 (Baton Rouge: Louisiana State University Press, 1958), 253-261.

  16. Michael Fellman provides an excellent examination of this phenomenon, which he calls “survival lying.” See Fellman, Inside War, 58, 264, 49-52, 195, 228.

  17. There are three major exceptions. First, eHistory works closely with David Holcomb of the Information Technology Outreach Services group at the Carl Vinson Institute of the University of Georgia. Because of my association with eHistory, I was able to reach out to David for help on many occasions, especially regarding ArcGIS Online. Second, I hired Brandon Adams—Senior GIS Technician at the University of Georgia’s Center for Geospatial Research—for GIS tutoring using funds from the Horace Montgomery fellowship in 2015. Last, I took a research seminar while at UGA entitled History, Mapping, and Spatial Analysis. While the course represented an eight-week version of the entry-level GIS course I took at WVU, I spent the second eight weeks of the course learning valuable information from the course’s professor: Dr. Sergio Bernardes (also employed with UGA’s Center for Geospatial Research). My sincerest thanks to all these men.

  18. George Mason University, “Roy Rosenzweig Center for History and New Media,” http://omeka.org/ (accessed March 22, 2020).

  19. For more information on Dublin Core standards, see, University of Tsukuba, Japan, “Dublin Core Metadata Initiative,” http://dublincore.org/ (accessed March 22, 2020).

  20. For more info, see ESRI, “ArcGIS Online,” https://www.esri.com/en-us/arcgis/products/arcgis-online/overview (accesses March 22, 2020).

  21. Footnotes 61 and 63 from Andrew Fialka, “Controlled Chaos: Spatiotemporal Patterns within Missouri’s Irregular Civil War,” in The Civil War Guerrilla: Unfolding the Black Flag in History, Memory, and Myth, Joseph Beilein, Jr. & Matthew C. Hulbert, eds. (Lexington: University of Kentucky Press, 2015), 61, 64.

  22. 1) follow the link to ‘Interactive Map with Accessible Database’; 2) Click ‘Content’ to pull up a menu where you can toggle off and on the map’s layers; 3) Expand the ‘Of Methods and Madness’ menu by clicking on the gray triangle next to ‘Of Methods and Madness’; 4) Scroll down to the layer entitled ‘Primary Source Data Displayed by City (Time)’; 5) Click on the ‘Show Table’ icon below any of the subfields in that layer.